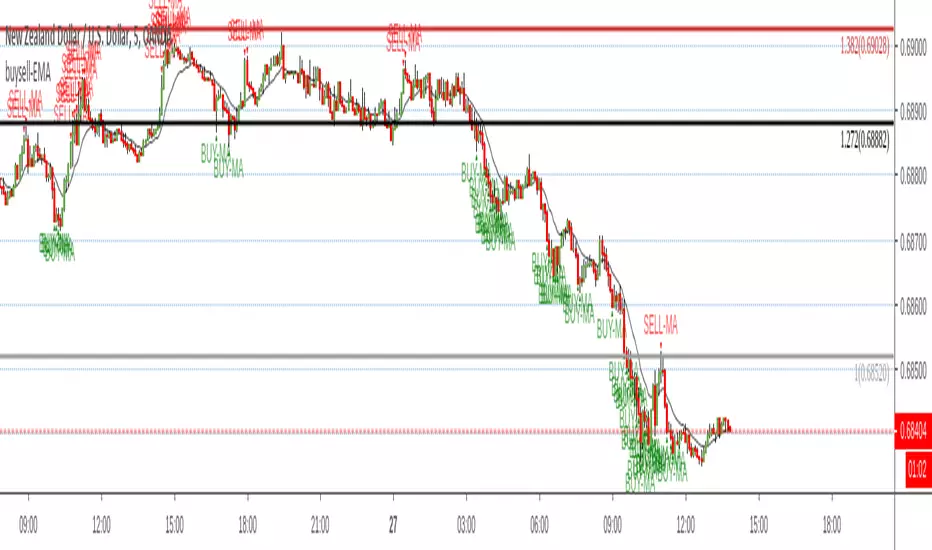
Reversal off EMASimple script find when a probable reversal will start. When price moves sharply away from the 13 EMA a BUY/SELL signal will pop up. Scripted to work on 5m 1h, 4h, and daily chart. But it doesn't work on all charts. Not sure why. I'm a forex trader and use this on NZDUSD. It doesn't give too good results on the JPY charts. I think its a fairly good reversal indicator. It definitely doesn't catch them all, and if there is a strong bearish or bullish impulse it doesn't work too well. But with all indicators, you need other conformations when to get in and when to get out. Hope it helps someone.
Tìm kiếm tập lệnh với "3 ema"
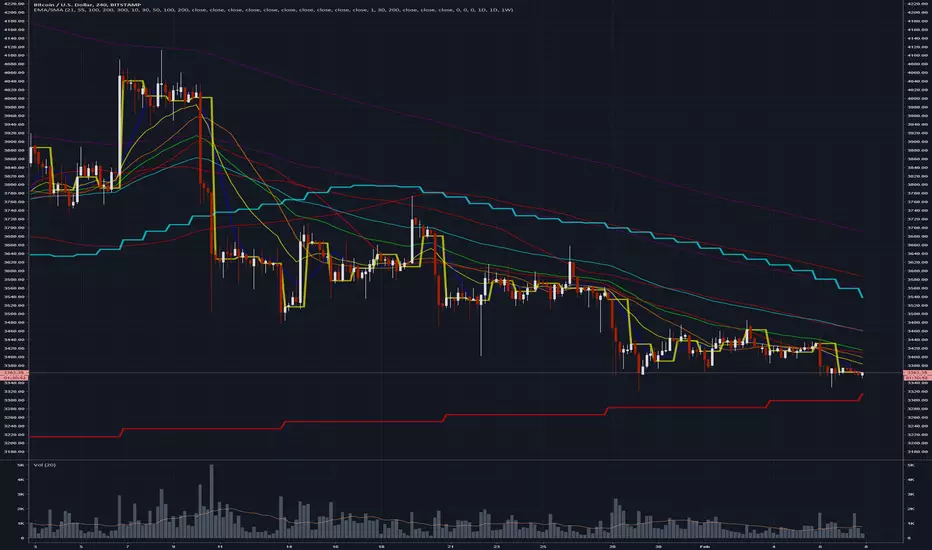
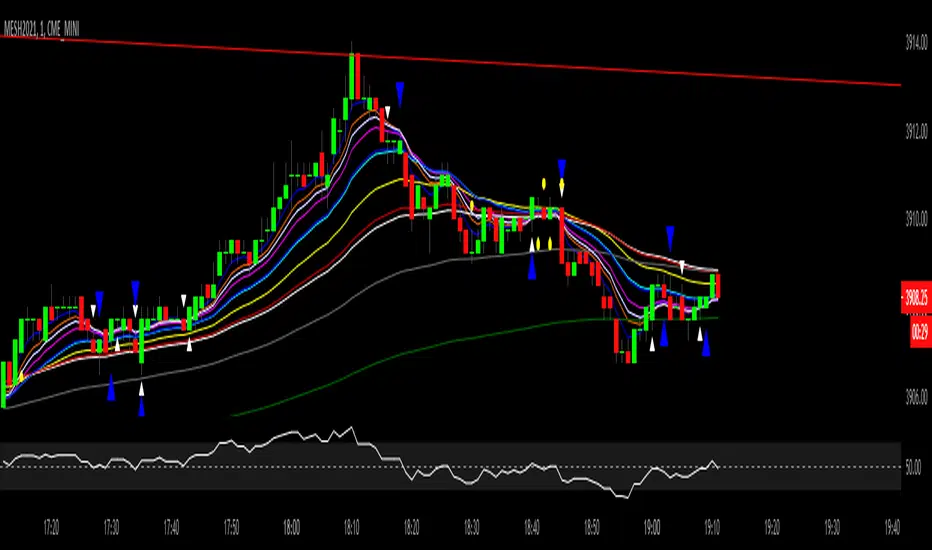
EMA SMA MultiCombo 2.0This script gives you up to 5 EMAs and 5 SMAs with custom length, close and color parameters.
Also, you can set up to 3 SMA with fixed, static timeframe input nondependent of the chart timeframe.
So, for example, you can set your chart to 5 min timeframe and see where 1D, 30D, 200W MA is.
Enjoy!

EMA SMA MultiCombo 2.0This script gives you up to 5 EMAs and 5 SMAs with custom length, close and color parameters.
Also, you can set up to 3 SMA with fixed, static timeframe input nondependent of the chart timeframe.
So, for example, you can set your chart to 5 min timeframe and see where 1D, 30D, 200W MA is.
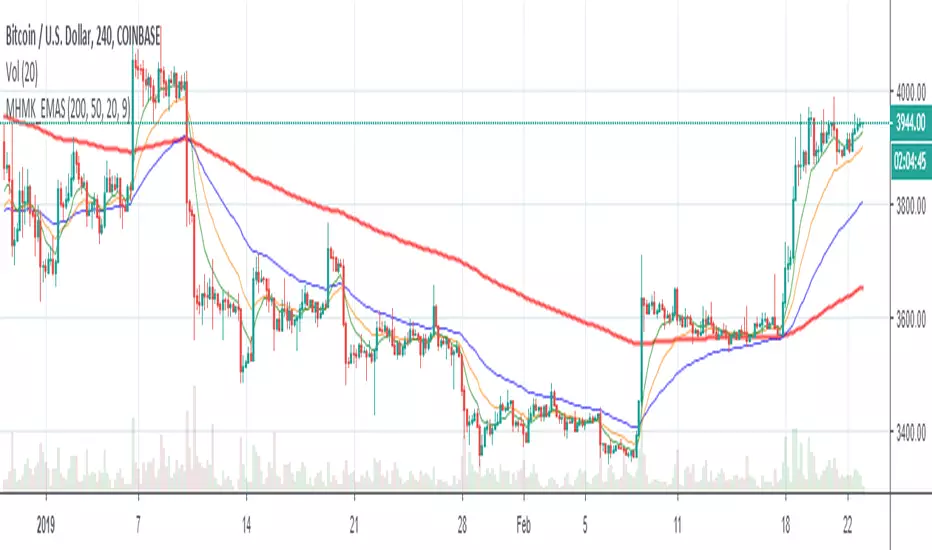
EMA SMA MultiComboJust a simple combo of 5 EMAs and 5 SMAs.
Custom lenght, custom color and custom source.


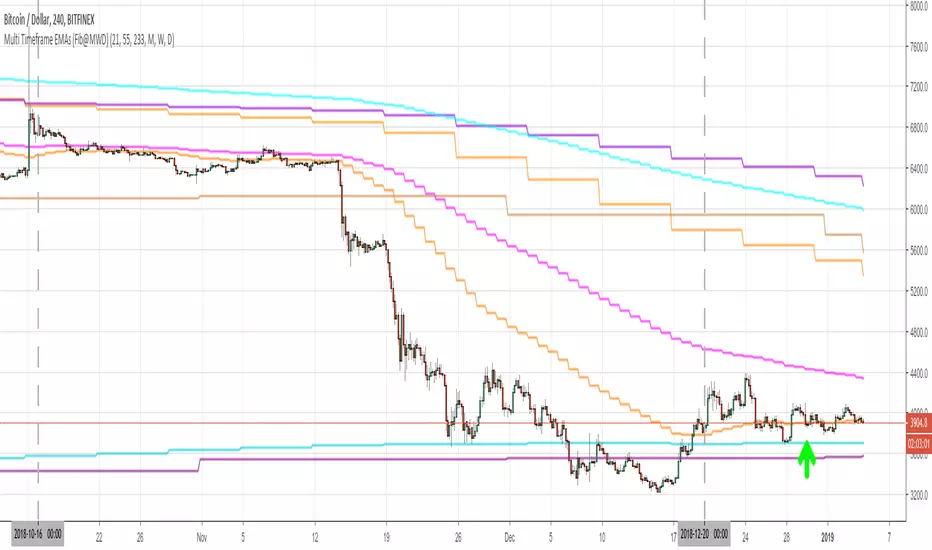
Multi Timeframe EMAs (Fib@MWD)plot fibonacci EMAs 21,55,233 on the timeframes monthly, weekly and daily.
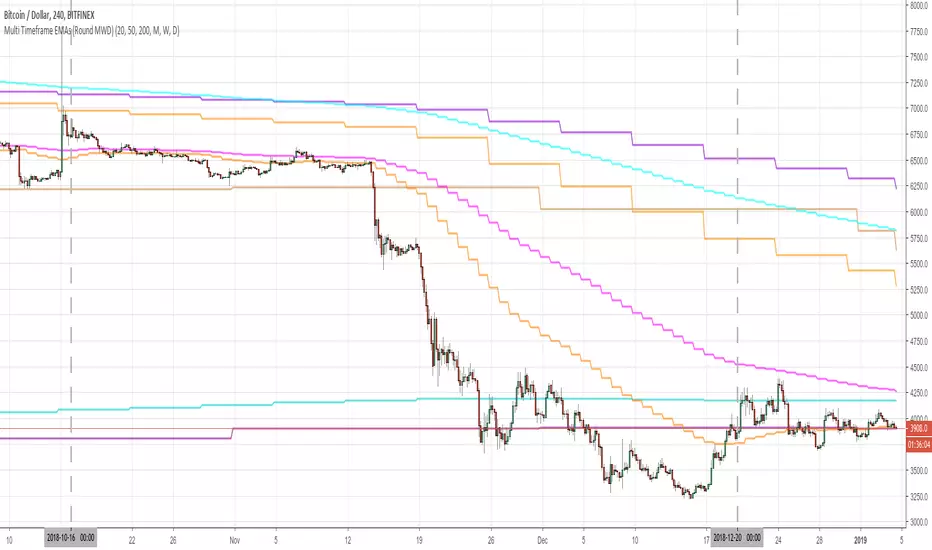
Multi Timeframe EMAs (Round@MWD)plot round number EMAs 20,50,200 on the timeframes monthly, weekly and daily.

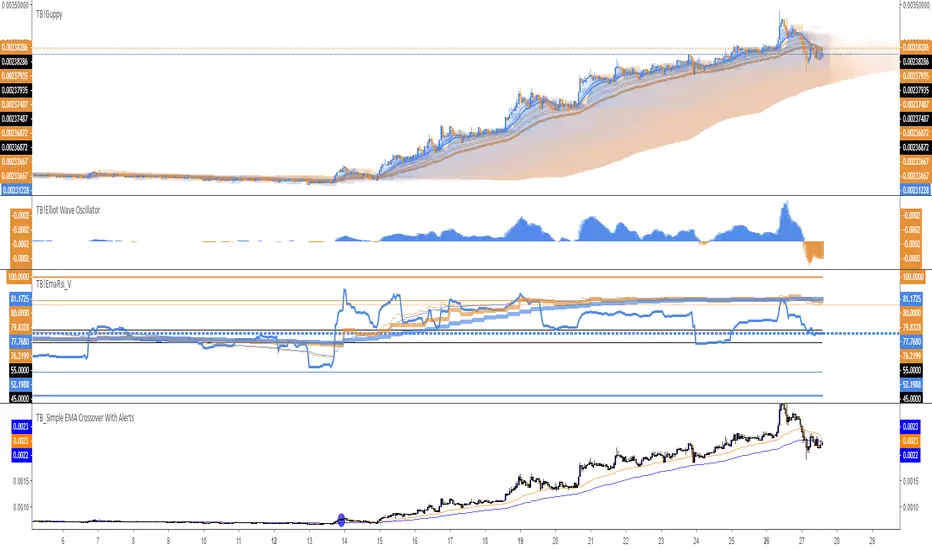
TB_Simple EMA Crossover With AlertsA SImple anti Repaint MTF EMA Crossover with Alerts
For more (Cooler) Custom Scripts PM me
EMA TEMA crossoverHello,
as usual recently the chart is bugged if I dare post a log one so I deleted and reposted...
here is a simple ema/team script that could allow you to catch trends.
You can play with parameters to get alerted of strong trends, or to detect trends early on.
I want to adapt this to an inside bar strategy, I am going to release that in a while, it is not my priority thought I am a countertrend trader, so I cannot say why, but what I have seen is inside bar breaks in very strong trends work very well.
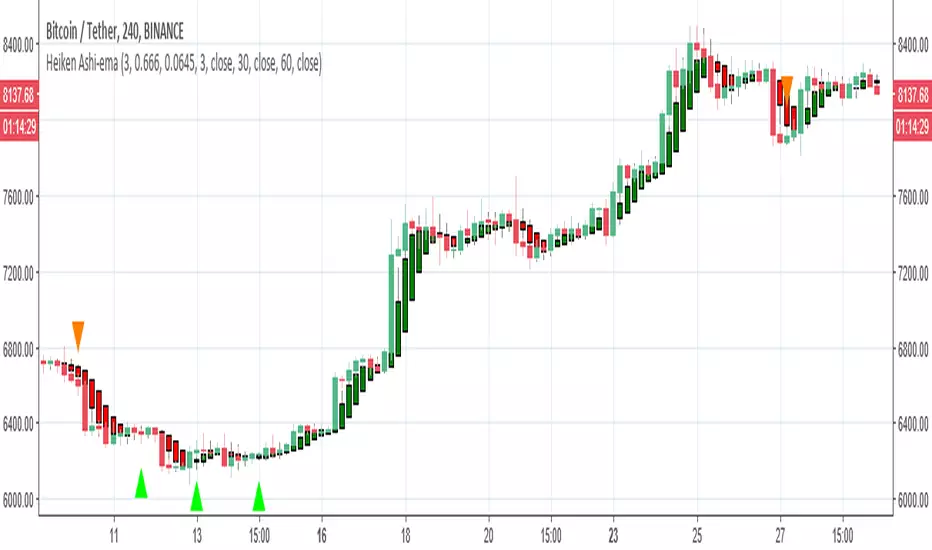
There is a condition for this inidcator to work: you have to use it on a Heikin Ashi chart (the candle type, selectable in the area right of the timeframe).
Works sometimes. I advice backtesting any strategy before using. Idk maybe this could work decently, seems to have given big winners on bch recently. That huge one from 600 to 1800 lol. *3
* No one should pay for things this simple by the way...

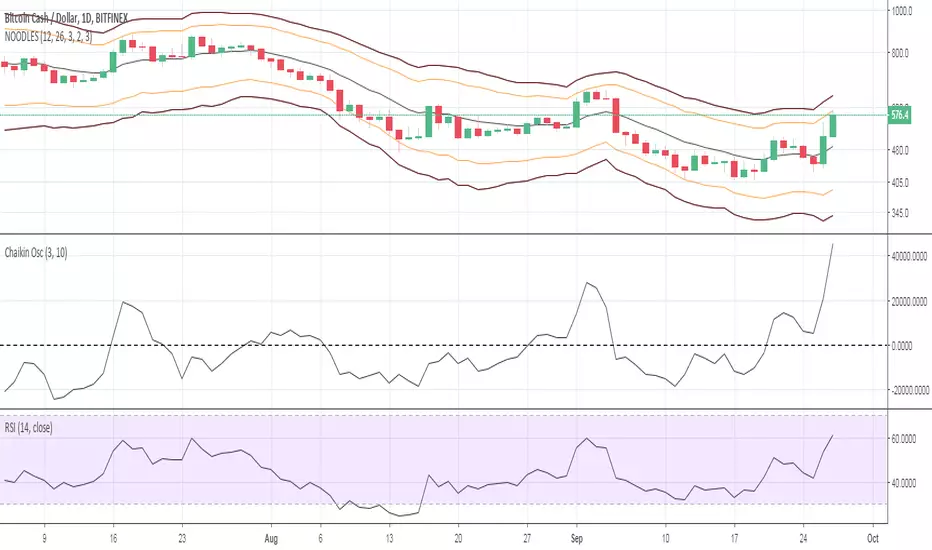
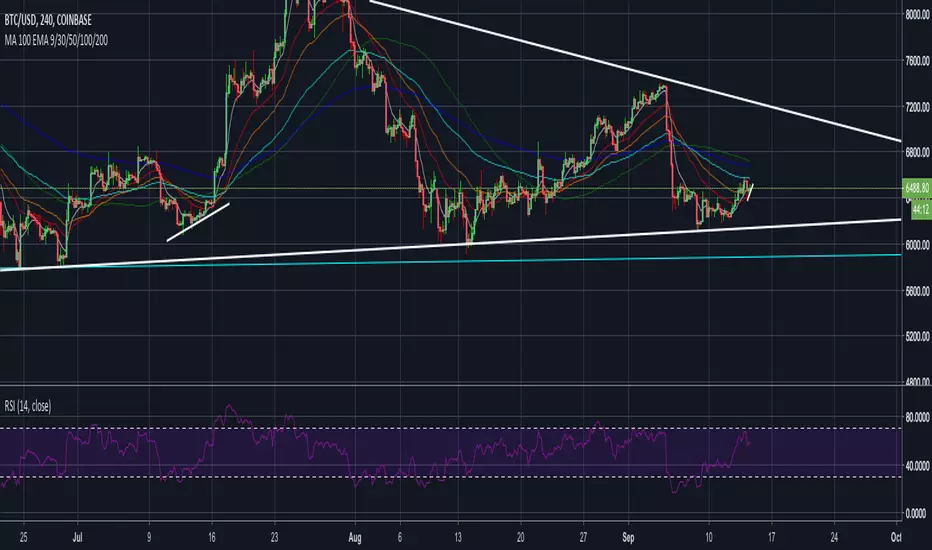
Noodles ema bands 12/26ema bands 12/26 for crypto trading, to find perfect support and resistance on each timeframe. 12/26 exponential moving average as you know is a perfect tool who working very well on bitcoin and others crypto. With this indicator now you have s/r too.
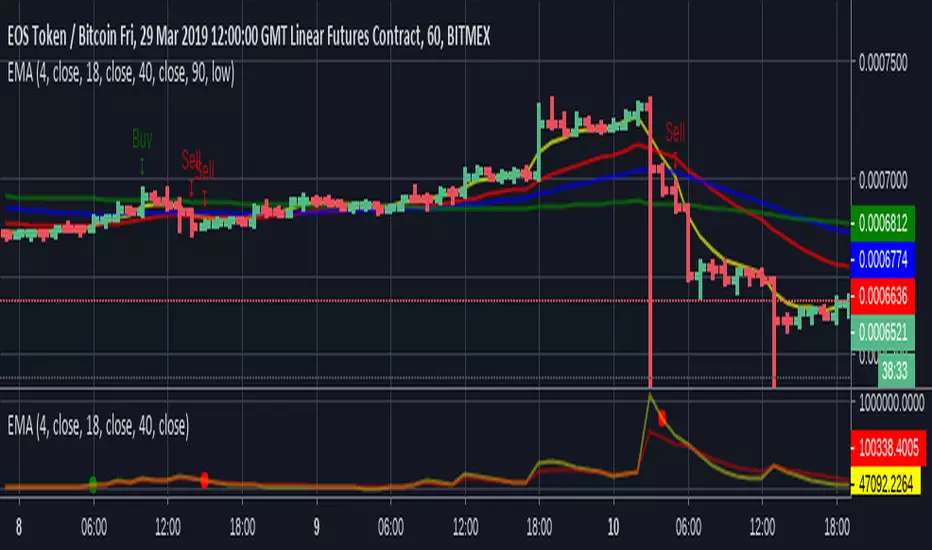
EMA cross+future triggersTravis Swing Method, with the next prices for the EMA crosses, green for the 1st in, blue for the 2nd in, and silver for the all in.
Red for the sell price, orange is others (actually the sell price for second in and all in)
Thanks to Travis and Hanaan for their great work!


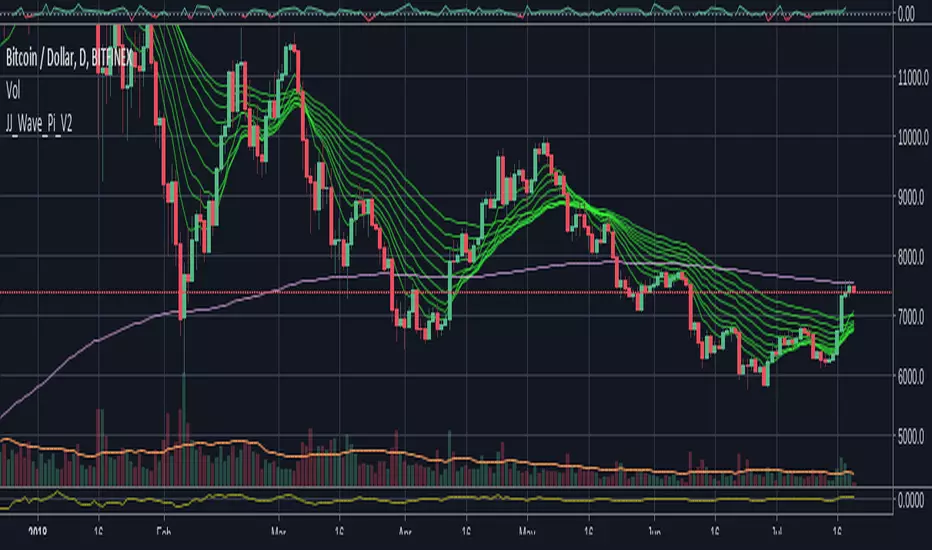
Jason Jenkins Wave plus Pi [Ver. 2] EMA & brighter colors.The Moving Average Wave and Pi Line. A little boredom led me to brighten the colors a bit and try out EMA instead of SMA, which I think produces a better wave. Enjoy
Multiple EMA 34(low-close-high)/89 by EricThis script supports for multiple EMA 34(low-close-high)/89 indicator.
EMA Bundle & Crossover PlotsJust a bundle of various EMAs and crossovers I use across different time frames.
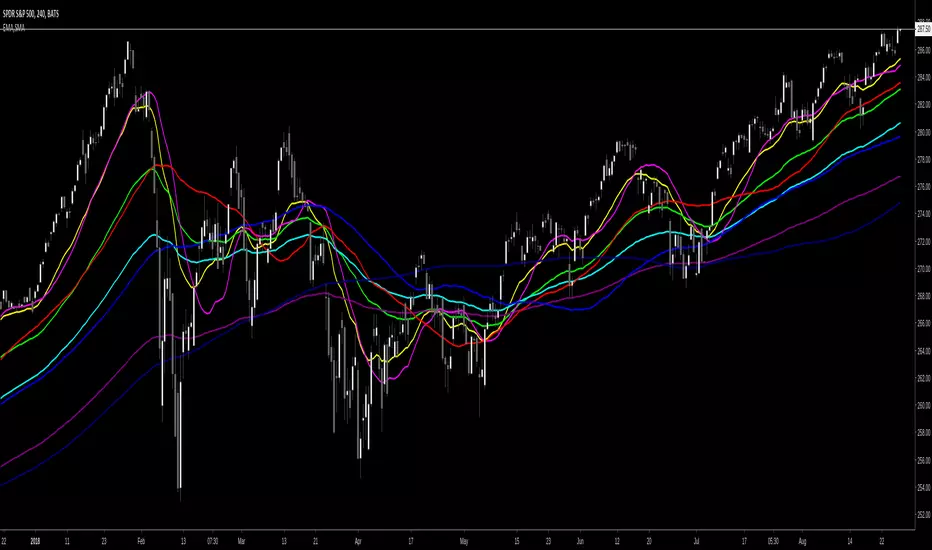
Moving averages (EMA & SMA) by magariMoving averages (EMA & SMA)
The script contains moving averages:
- Exponential Moving Averages: EMA20, EMA50, EMA100, EMA200
- Simple Moving Averages: SMA50, SMA100 & SMA200.
You can display all of them in one chart and they count as one indicator (perfect for non pro users) switch each of them on or off and change their colors and line widths.
